Introduction
Our lab uses computational, analytical, and experimental approaches to a variety of biological and biomedical problems. The goal of the research is to gain a better understanding of the fundamental mechanisms of the system. Below you can find a brief synopsis of our research in the area of Cell Motility and Cardiac Dynamics. For more details, please see our publications.
Cell Motility Back to Top
Many eukaryotic cell types can move using a crawling type of motion during which cells extend one or more transient and self-organizing actin-driven projections called pseudopods. In the absence of any extracellular cues, these pseudopods appear at random locations along the cell membrane. In the presence of a cue, however, pseudopods are preferentially formed in a particular direction, resulting in persistent and directed motion. A well-studied example of such a cue is the presence of an extracellular chemical gradient. The resulting chemically guided motion, called chemotaxis, underpins many biological processes, including wound healing, cancer metastasis, and embryogenesis.
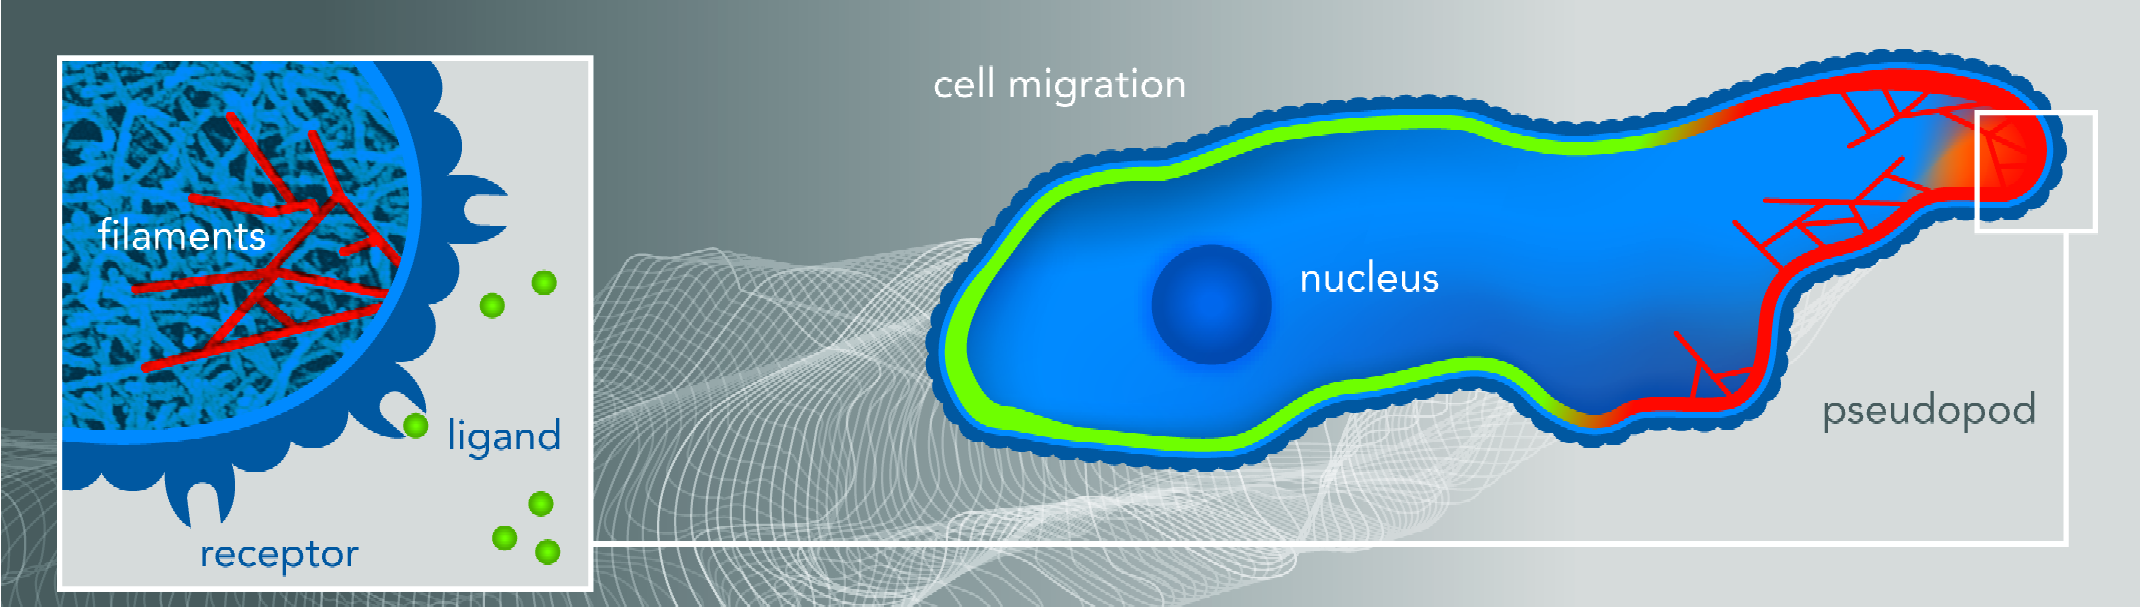
This figure shows a cartoon of a cell moving to the right directed by a chemotactic gradient schematically shown by the gray scaled background. The cell is polarized with some signaling components localized at the front, depicted by red membrane, while others are localized at the back (green membrane). The outline of the membrane at previous times is shown by the white lines. Pseudopods (membrane protrusions) are generated mostly at the front of the cell and are associated with certain signaling components, shown by the orange color field. The inset shows the branched actin network that push the membrane forward, with several individual filaments highlighted in red. The external chemical gradient is detected by the cell through the binding of ligands, shown as green balls in the inset, to membrane bound receptors.
Our lab aims focuses on determining the various processes involved in chemotaxis using the model organism Dictyostelium discoideum. This amoeba moves very fast (approximately 1 cell diameter per minute), does not require special environmental conditions, and can be genetically modified to create mutants and fluorescent reporters. A typical response of a Dictyostelium cell to a pipette filled with the chemoattractant cAMP is shown in this movie, courtesy of the Firtel laboratory.
We are particularly interested in applying well-defined perturbations to the cell and quantifying their responses. Microfluidic devices are able to precisely control the experimental conditions experienced by cells and have become an integral component of our chemotactic experiments. All these devices are designed and fabricated in collaboration with the Groisman laboratory at UCSD. The results of these experimental observations are then interpreted with the aid of mathematical modeling. The models we construct from simple ones in which we ignore the cell's spatial extent, to more complicated ones in which we explicitly solve for the moving and deforming cell boundary. An example of the outcome of a simple model is shown in the movie below. In this model, the membrane is represented by a set of nodes which is moved by a set of physical rules. In this particular example, the parameters are chosen such that the computational cell trajectory is similar to the trajectory of the cell in the experimental movie shown above.
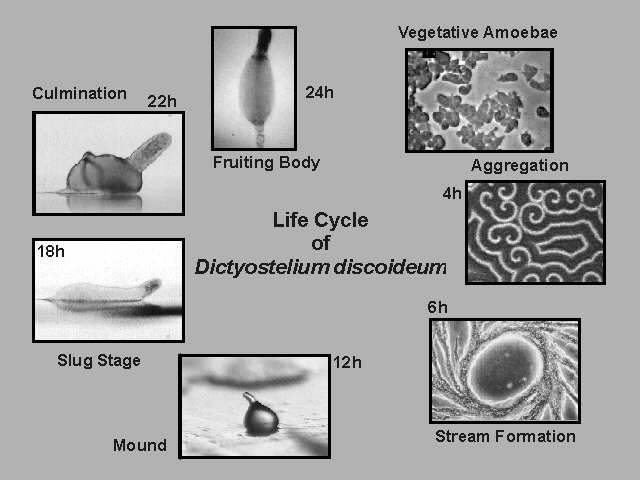
On the multi-cellular level, Dictyostelium displays a remarkable self-organization when deprived of food: upon starvation, and aided by chemotaxis single amoebae aggregate into to a multicellular slug. During this process, cells differentiate into either pre-spore cells or pre-stalk cells. The latter eventually become stalk cells that support the spore cells. The various stages in its development are nicely captured in these composite pictures:
|
|
We are interested in the role of cell sorting during this developmental process. This can be conveniently studied in an experimental set-up in which the vertical dimension in constrained and where pre-spore and pre-stalk cells are labeled with fluorescent markers. An example of a resulting movie is shown here, where pre-spore cells are labeled with GFP and pre-stalk cells are labeled with RFP.
Cardiac Dynamics Back to Top
In healthy people, an electric wave passes over the heart's surface about once a second causing the tissue to contract in a regular fashion. Some people however, suffer from cardiac arrhythmias which cause irregular activity of the heart. Certain arrhythmias are relatively benign, but others have dire consequences. Atrial fibrillation (AF) is the most common of these arrhythmias and currently affects 5 million people in the USA alone. AF is a serious health concern and leads to increased morbidity and even mortality. Often, these patients are treated using ablation therapy during which large parts of the atrial tissue are destroyed. Unfortunately, the success rate of this treatment is suboptimal.
Unfortunately, the precise mechanisms that initiate and maintain human AF are not well understood. Part of the reason for this incomplete understanding is the difficulty in obtaining accurate human maps of spatio-temporally varying electrical activity in AF. In collaboration with the group of Dr. Sanjiv Narayan (UCSD and VA Medical Centers), we have developed a novel high-resolution mapping technique termed focal impulse and rotor mapping (FIRM). This technique uses two 64-pole contact electrode catheters in the form of ‘baskets’ that are advanced to the right atrium (RA) and, after trans-septal puncture, to the left atrium (LA). FIRM produces activation maps with high spatial and temporal resolution.
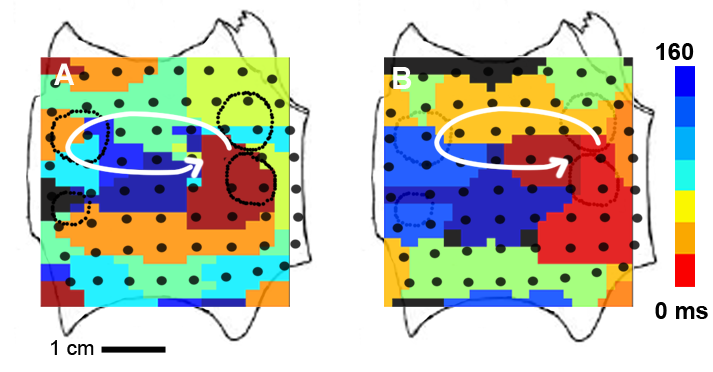
With FIRM we were able to determine, for the first time, that human AF is perpetuated by a small number of spiral waves or focal sources. Unexpectedly, these sources were found to be stable over a prolonged period of time (hours to months). This is shown in the snapshot below where we plot two isochronal maps of a left atrial rotor in a AF patient obtained 237 days apart. The image on the left is the isochronal map of a left atrial rotor obtained prior to conventional ablation. Atrial fibrillation failed to terminate during ablation, and recurred after the procedure. The isochronal map on the right shows a left atrial rotor at the same location obtained at repeat electrophysiology study 237 days later. In these maps, the activation times are shown using a color scale.
We also demonstrated the mechanistic relevance of these sources to sustaining AF by brief targeted ablation only at sources, which acutely terminated AF with subsequent inability to induce AF (‘non-reinducibility’) in a majority of patients. For example, targeted ablation at the source of the spiral wave in the patient shown above eliminated AF. An example of this acute termination is shown in this movie.
Importantly, the long-term results of this novel ablation approach have recently been shown to be substantially better than conventional ablation of empirical anatomic targets without knowledge of the propagation patterns in any given individual. This approach is currently being commercialized by Topera Medical.